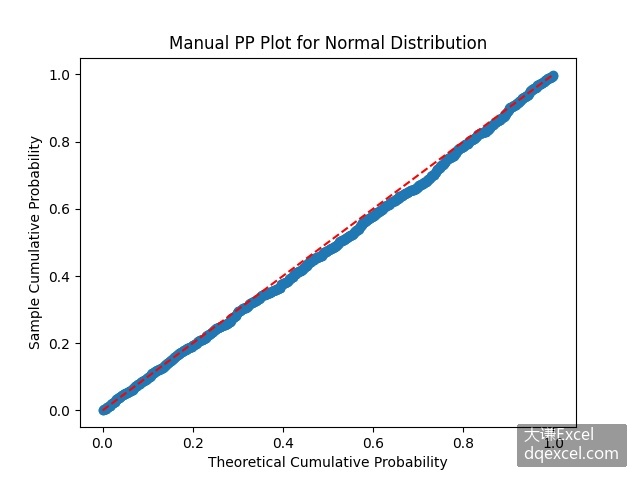
PP图常用于检验一组给定数据是否服从指定的分布,或者两组数据是否同分布。根据给定数据绘图,编写Seaborn代码如下所示:
code.python
import numpy as np
import scipy.stats as st
import matplotlib.pyplot as plt
# 生成随机数据
np.random.seed(0)
data = np.random.normal(loc=0, scale=1, size=1000)
sorted_data = np.sort(data)
# 计算理论分位数
n = len(sorted_data)
x_labels_p = np.arange(1/(2*n), 1, 1/n)  # 理论累积概率
y_labels_p = st.norm.cdf(sorted_data)    # 样本累积概率
# 绘制PP图
fig=plt.figure()    #新建绘图窗口
plt.scatter(x_labels_p, y_labels_p)
plt.plot([0, 1], [0, 1], 'r--')  # 45度参考线
plt.xlabel('Theoretical Cumulative Probability')
plt.ylabel('Sample Cumulative Probability')
plt.title('Manual PP Plot for Normal Distribution')
plt.show()
运行代码,生成下图。