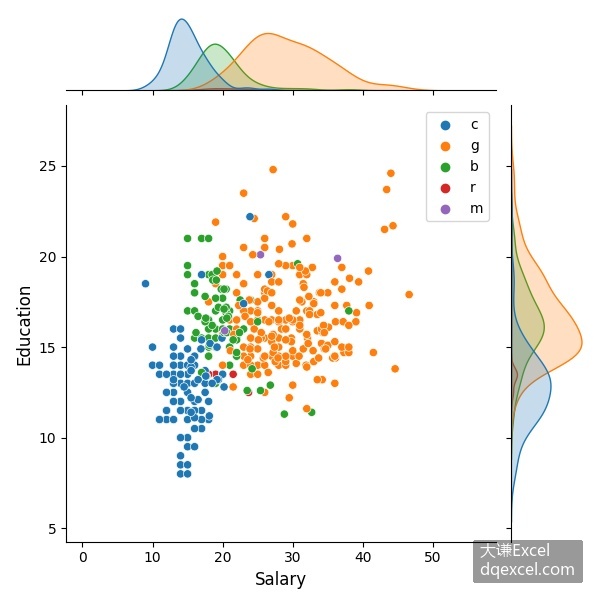
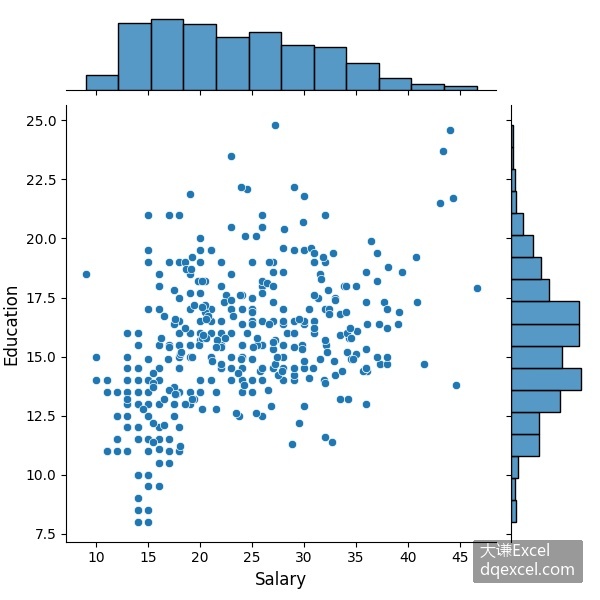
边际图是一种组合图形,图的中心是二元散点图或分箱散点图,两侧是数据在对应方向上的一元直方图、核密度估计图或箱形图等。
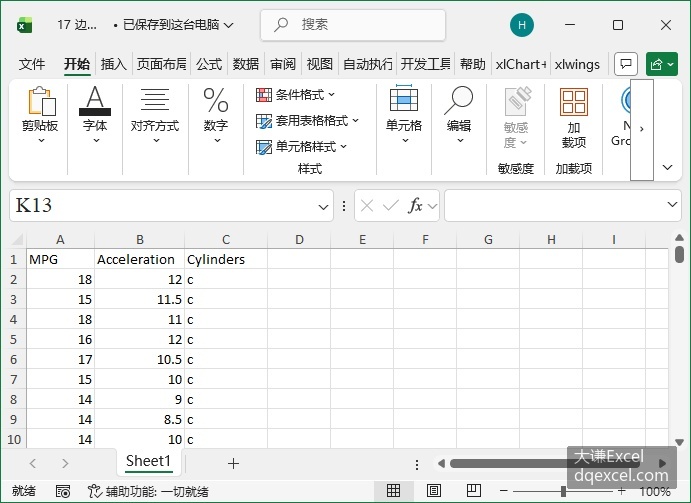
根据给定数据绘图,编写Seaborn代码如下所示:
code.python
import matplotlib.pyplot as plt    #导入Matplotlib包的pyplot子包
import pandas as pd    #导入pandas包
import seaborn as sns
df=pd.read_excel('17 边际图.xlsx',engine=';openpyxl')    #导入数据
fig=plt.figure()    #新建绘图窗口
sns.jointplot(df,x='MPG',y='Acceleration')
plt.xticks(fontsize=10)
plt.yticks(fontsize=10)
plt.xlabel('Salary',fontsize=12)
plt.ylabel('Education',fontsize=12)
plt.show()
sns.jointplot(df,x='MPG',y='Acceleration',hue='Cylinders')
plt.xticks(fontsize=10)
plt.yticks(fontsize=10)
plt.legend(fontsize=10)
plt.xlabel('Salary',fontsize=12)
plt.ylabel('Education',fontsize=12)
plt.show()
运行代码,生成下图。